
In my earlier article, I’ve explained about the methods to collect long running stored procedures in SQL Server using extended events and profiler. Now we’ll see how to collect the blocked processes and deadlocks using extended events and SSMS.
Steps For Creating XEvent Session And Events
The detailed steps for creating extended events is available in the article Find Long Running SPs. Follow the steps in the article to create a session and substitute the events and actions given here. Below, I’ve given the details on the events and actions you can use for collecting blocked processes and deadlocks.
Events Needed To Collect Deadlocks And Blocked Process
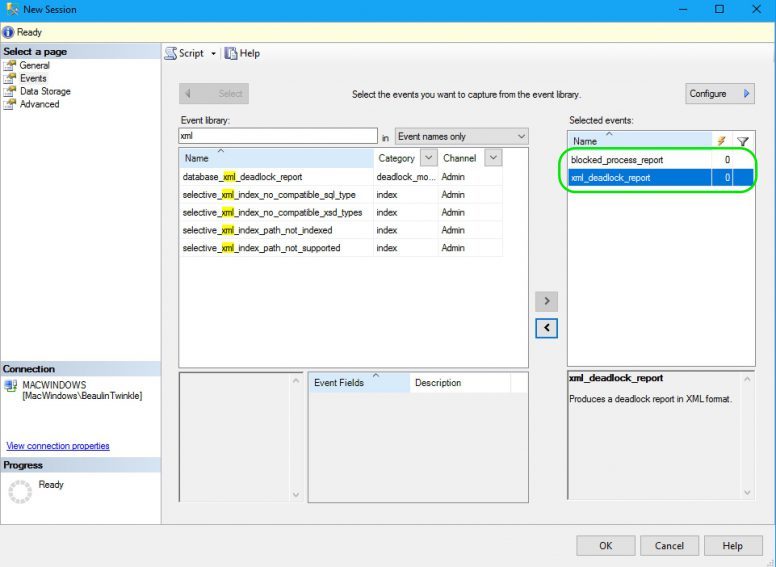
Below are the events which needs to be selected while creating a session. We have to select both the blocked process and deadlock together, as they used to happen concurrently.
- blocked_process_report
- xml_deadlock_report
Adding Actions
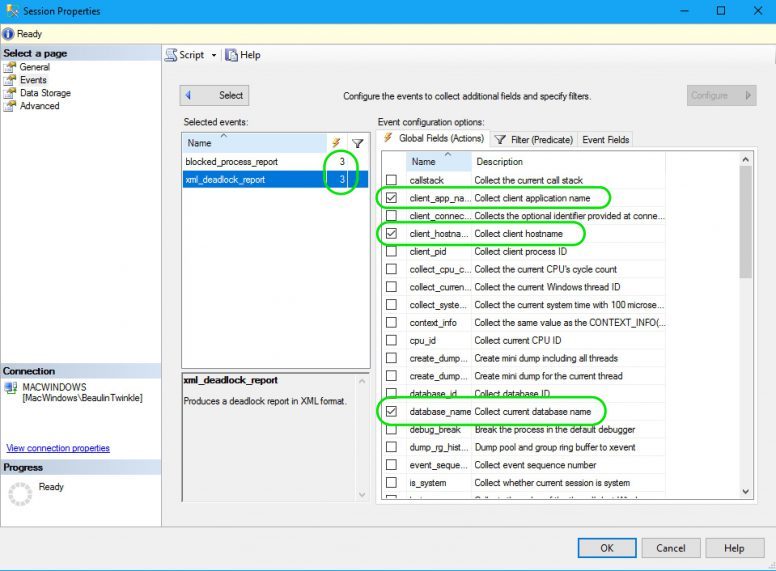
You can add actions as you prefer. I’ve selected few actions for the events blocked_process_report and xml_deadlock_report. Below are the actions I’ve selected.
- client_app_name
- client_hostname
- database_name
Set Block Process Threshold
There is one more step. After creating the session, you need to set the blocked process threshold option using sp_configure. Only after setting this option, blocked process report will be generated. Here, I’ve set the blocked process threshold to 10 seconds, so as the report will be generated every 10 seconds if there is a block in the system. Execute the below code to set the advanced configuration.
<br>
EXEC sp_configure 'show advanced options', 1 ;<br>
GO<br>
RECONFIGURE ;<br>
GO<br>
EXEC sp_configure 'blocked process threshold', '10';<br>
RECONFIGURE<br>
GO<br>
Now, the setup is ready. You have to start the session to collect the blocked processes and the deadlocks.
Viewing The Collected Deadlock/Blocked Processes Reports
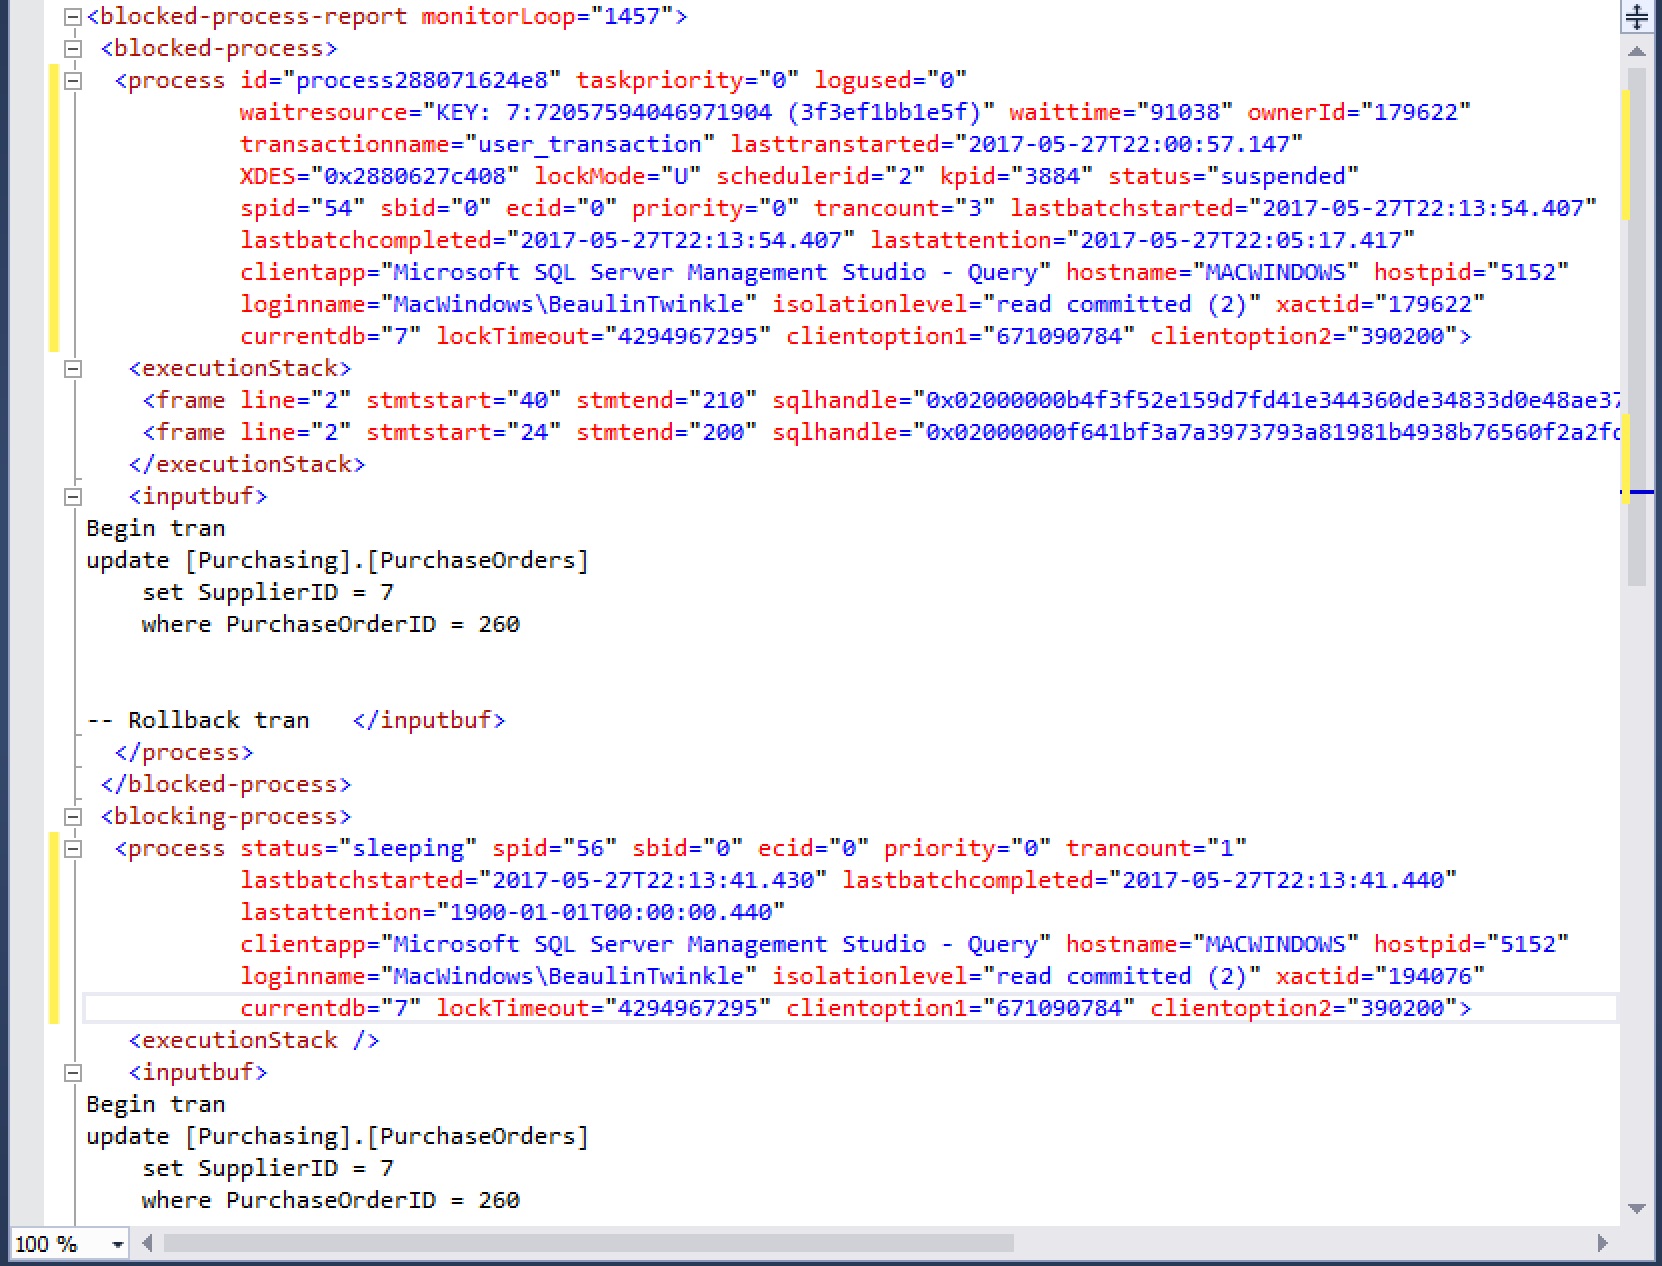
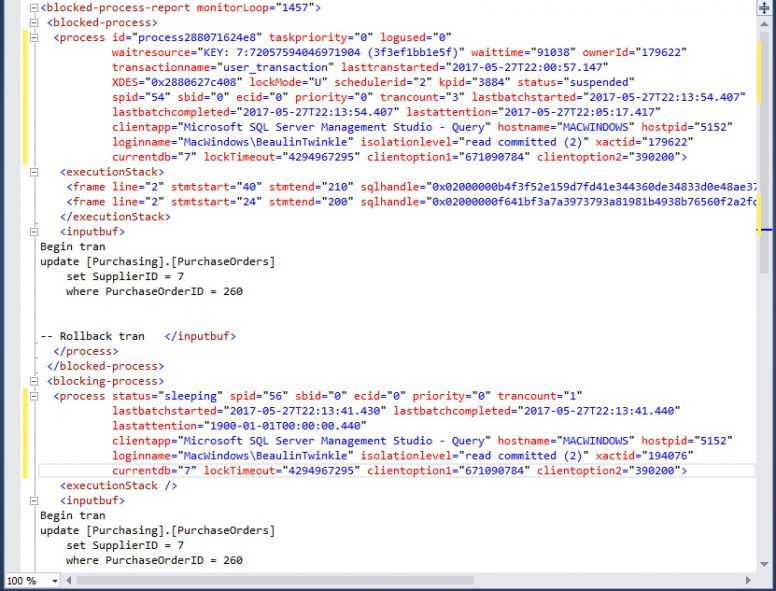
Once the blocks and deadlocks are collected, you can see the collected data as below. For illustration purpose, I’ve simulated a blocked processes / deadlock scenario and got the below result.
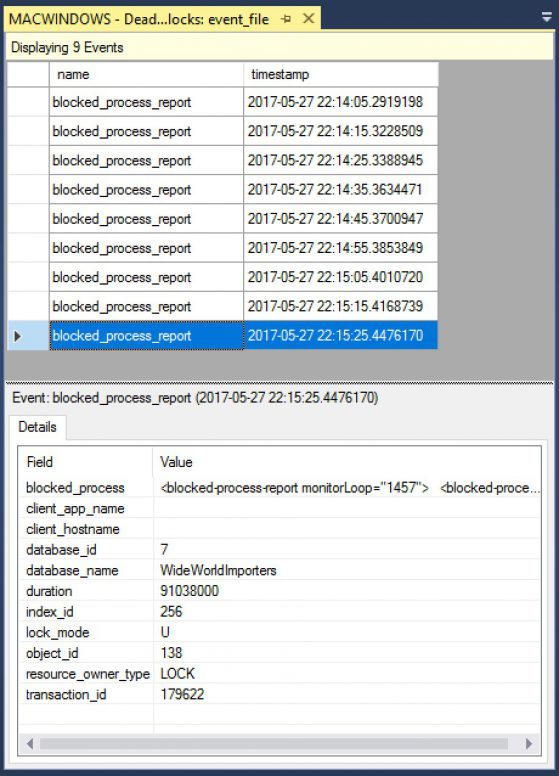
In the result section, if you double click the xml value of the blocked_process, you will get the detailed about the blocked query, client details, etc..
Reference
- About XEvents at SQL Server Extended Events.
- Creating XEvents to collect deadlocks without using SSMS GUI.
Related Article
- Read about finding active connections in SQL Server.