
SQL Server Profiler is a tool with user interface to capture and manage traces of events. It is also used to analyze and replay trace results. These trace results can be saved as trace file or to a table in database or as a xml file. These files and table can be opened again in profiler for analyze and diagnose a problem. Even though the profiler is now depreciated, it is still available in SQL Server 2017 and used by many DBAs and programmers for debugging issues in SQL Server.
There are several ways for launching SQL Server profiler from a windows workstation. You can launch it from the start menu or from SSMS or from database engine tuning advisor. However, the easiest way is to launch from the start menu.
Launch Profiler From Start Menu
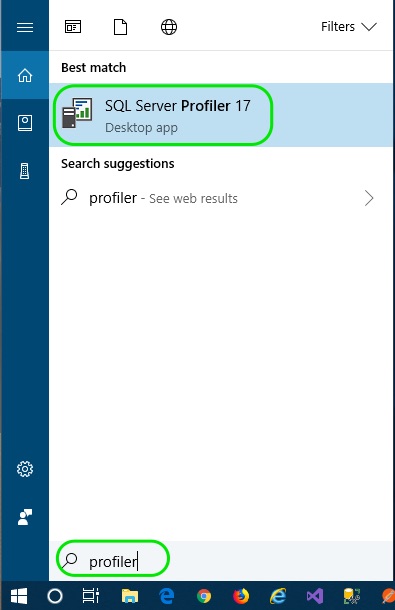
- Press the start icon in Windows 10.
- Start typing profiler.
- When the SQL Server Profiler 17 tile for desktop app appears, press it to launch the profiler.
Next Steps
- Collecting poor performing queries and storing them in database table for further analysis.
- How to find long running stored procedures In SQL Server? Step by step illustration to find slow running SQL Server stored procedure.
- How to filter profiler trace to display events from a specific database? Step by step instruction to filter the profiler to trap only the events for a specific database alone.
- How to debug queries inside stored procedure using profiler? Here is the step by step instruction for debugging queries inside stored procedure using profiler.
- How to capture only the stored procedures using profiler? Using profiler trace to trap all the stored procedures executed against a database.
- How to capture a stored procedure and the parameter values passed to it every time it is executed? Here is a method for capturing stored procedure’s parameter values using SQL Server Profiler.
- What are filters in SQL Server profiler trace and how to use them to capture various events? Here I have explained using filters in profiler trace and when to use them.
- How to monitor specific table using profiler in SQL Server? Here is a simple trick to capture and monitor all the queries and stored procedures executed against a table.
- How to save the collected profiler trace to a table in SQL Server? Here are the steps for saving profiler trace results to a table for further analysis.
- Tracing errors and exceptions using SQL Server profiler: Using SQL Server profiler is the easiest way to capture the errors and exceptions occurring in the SQL Server database.