

In my earlier article, we have seen how to create a website using Python and Django. Debugging is a vital part of any kind software development including web development. Here in this article, you will read about basics of debugging Python Django web application in Visual Studio Code editor.
Creating debugger launch profile
Let’s start by creating a launch profile. Apart from starting the Python web application debug mode, the launch profile also helps in starting the web server quickly by eliminating the process of typing in a command in the terminal every time. Here are the steps to create a launch profile.
- Open the Django web project in Visual Studio Code.
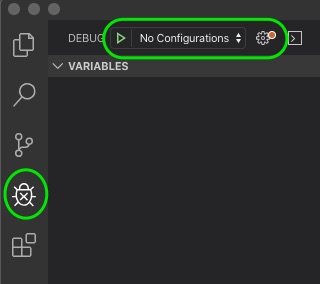
- Press the debug icon at the left activity panel to open the debug panel in VS Code.
- Press the settings icon (gear icon) with a warning dot at the top, next to the No Configuration.
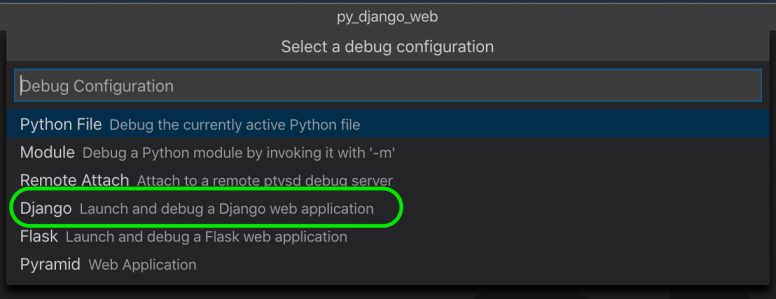
- A prompt box appears with the list of debugger options. From the list select Django: Launch and debug a Django web application.
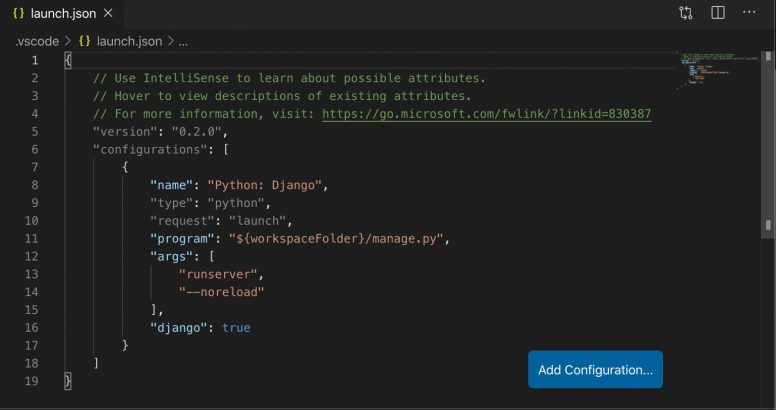
- A configuration file named launch.json will be created in the .vscode folder and opens in the editor panel. Make sure the content of the file is similar to the screenshot below. The values in the program and the args section performs similar to the terminal command python3 manage.py runserver –noreload which starts the server in debug mode.
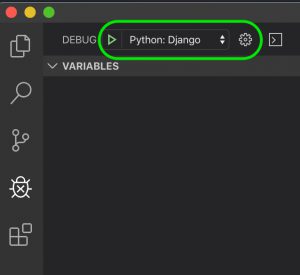
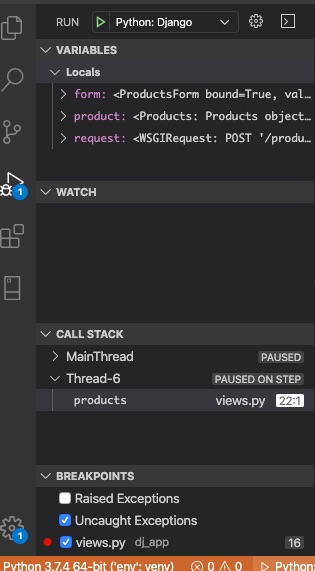
- Save the file and check the debug configuration drop down list at the top left. Python: Django will be selected by default. If not, choose it manually.
- Now, the launch profile setting is over.
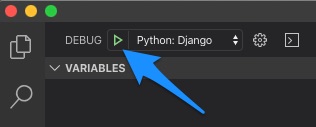
- You can start the web server and the debugger just by pressing the green arrow found in between DEBUG and Python: Django. Other ways to start the web server in debug mode is by pressing F5 key or by going to the menu >> Debug >> Start Debugging.
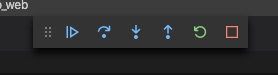
- You can identify whether the web server is started in the debug mode or not based on the changes happened in the Visual Studio Code editor. A debugging toolbar appears at the top and the color of the status bar changes to orange.
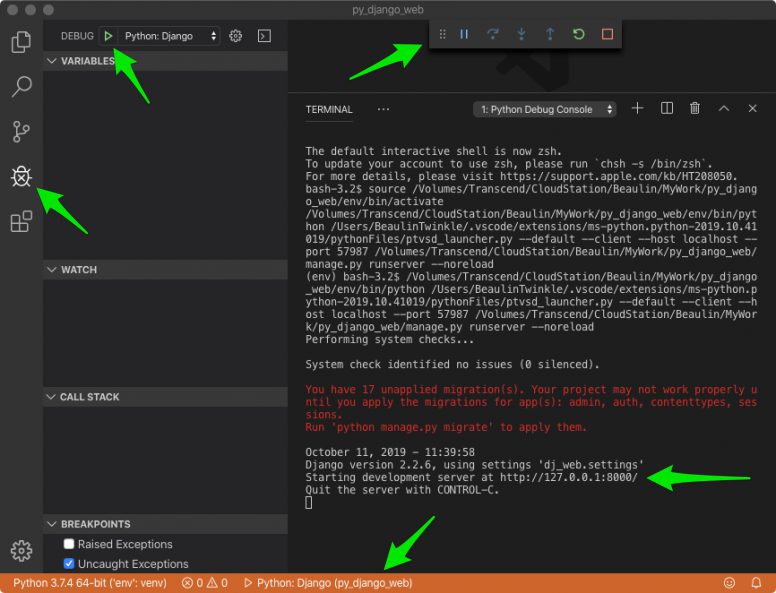
- To open the web app in the browser either command+click the url http://127.0.0.1:8000/ or copy and paste it to the browser.
- Once done, don’t forget to close the web server by pressing CONTROL + C.
NOTE: If you want to start the web server without debug mode, then press the Control + F5 keys.
Once the launch profile is set, you can launch the website in debug mode and perform the debugging operations like break-point, go to definition, peek definition etc.
Debugging using break-points
Let’s see how to perform debugging. To debug a specific part of the code, you have to use breakpoints to pause the running program at specific line of code. Let us see how to use break-points in VS code.
- Make sure the web server stopped. If not, then stop is by pressing CONTROL + C in the terminal.
- In the Django web project, open a .py file which is required by a specific web page. For this illustration I’m using views.py.
- In the views.py, choose a view definition function where you need to have a break-point. For this illustration I’m choosing the products function.
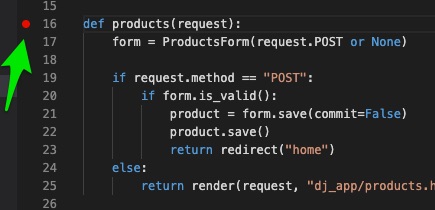
- Set a break point at the margin of the line def products(request) by just clicking the margin of the line at the left side from the line numbers. Other ways to create break-point are:
- Right-click the margin left of the line number and select Add Breakpoint. (or)
- Place the cursor at the specific line and press F9.
- Place the cursor at the line and go to menu and select Debug >> Toggle Breakpoint.
- The break point is visible as a red dot at the margin.
- Now start the web server and the debugger. (Just press the green arrow found in between DEBUG and Python: Django.)
- Make sure the status bar changes to orange color.
- Open the web app and navigate to the page for which you have created the break-point for.
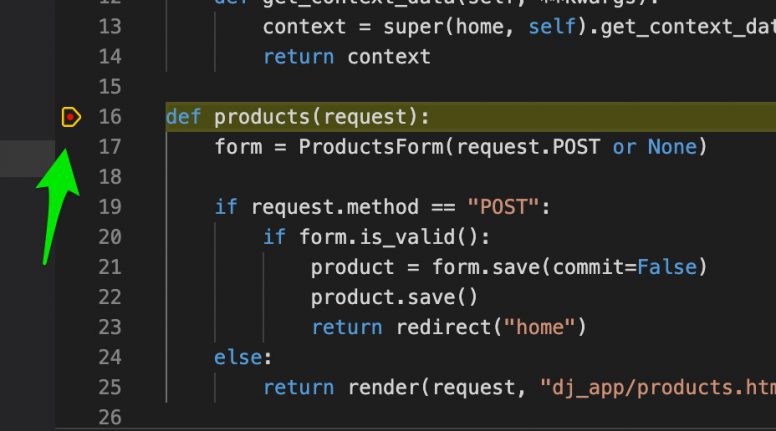
- Before the page renders the system will pause at the break-point. You can see the yellow arrow at the red break-point. The yellow arrow indicates the next line to be executed.
- Using the debug toolbar at the top or by using function keys, you can Continue (F5), Step over (F10), Step into (F11), Step out (Swift+F11), Restart (Shift+Command+F5) and Stop (Shift+F5) debugging.
- While debugging, you can use the left panel sections like Variables, Watch, Breakpoints, etc to review the local variables, arguments, watch list, list of breakpoints, etc.
Go to & peek definitions
Apart from breakpoints debugging, the commands like Go to Definition and Peek Definition helps you to see the code that defines an object.
Go to Definition
This command will open the file containing the code that defines the object and the cursor jumps to the code. To use this command, place the cursor at the object and right click to open the context menu. From the context menu select Go to Definition.
Peek Definition
Peek is similar to Go, however, instead of opening the code file, this command, displays the section of the code that defines the object in the same window. To use this command, place the cursor at the object and right click to open the context menu. From the context menu select Peek and then Peek Definition.
Further Reading
- There are lot more debugging options in Visual Studio Code editor. You can read them at VS Code Docs.
- Python Django web application: Creating code snippets in Visual Studio Code.