
Today I am writing about a simple trick to capture and monitor all the queries, batches and stored procedures executed against a table in SQL Server. I have used SQL Server Profiler for monitoring specific table in a database and capturing the events executed against it.
Here are the steps for using profiler to monitor the events against a table:
- From the profiler trace window, go to menu Files > Properties.
- In the Trace Properties window, select Blank for Use the template.
- Go to Events Selections tab.
- From the left Events panel, Expand Stored Procedures and select:
- RPC:Starting.
- SP:StmtStarting.
- In addition, you can select RPC:Completed and SP:StmtCompleted. These events will help you to get the time duration of the statement execution.
- From TSQL event category, select:
- SQL:BatchStarting.
- SQL:StmtStarting.
- In addition, you can select SQL:BatchCompleted and SQL:StmtCompleted.
- Make sure the check box Show all columns is selected.
- Press the Columns Filters… button below.
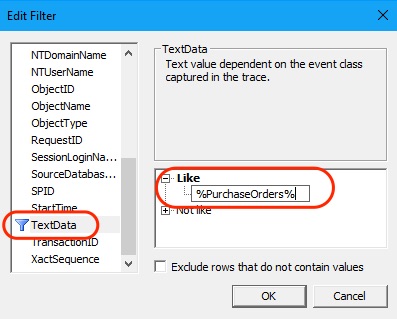
- In the Filter pop-up window, from the left panel select TextData.
- From the right panel, under Like tree node, enter the table name padded with percentage symbol. For example %PurchaseOrders%.
- Optionally, if you want to filter for specific database then:
- from the left panel, select DatabaseName.
- From the right panel, under Like tree node, enter the database name.
- and press OK.
- Then, press Run button to start the trace.
You will see the trace is filtering and showing only the queries and other events running against the table.