
One of the important job of a database programmer or and administrator is to maintain the performance of the database queries, stored procedures and functions as fast as possible. In-order to maintenance the performance of the queries, you have to monitor them continuously and collect poor performing queries, analyze them and solve the performance issues.
There are several ways to monitor the slow performing queries. You can use SQL Server Profiler, Extended Events or Dynamic Management Views (DMV). Here we will see how to collect poor performing queries and store them in a database table for further analysis using the SQL Server profiler.
Steps For Collecting Poor Performing Queries
- Launch SQL Server Profiler.
- From menu >> File >> select New Trace… .
- In the Connect to Server window, select the sever, enter the user credentials and press Connect.
- In the trace profiler window, Enter a name for the trace under the General section Trace name.
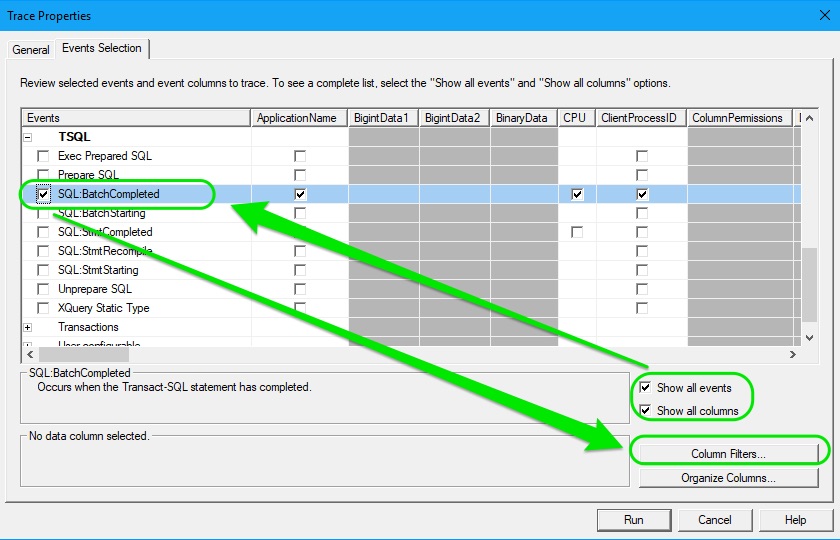
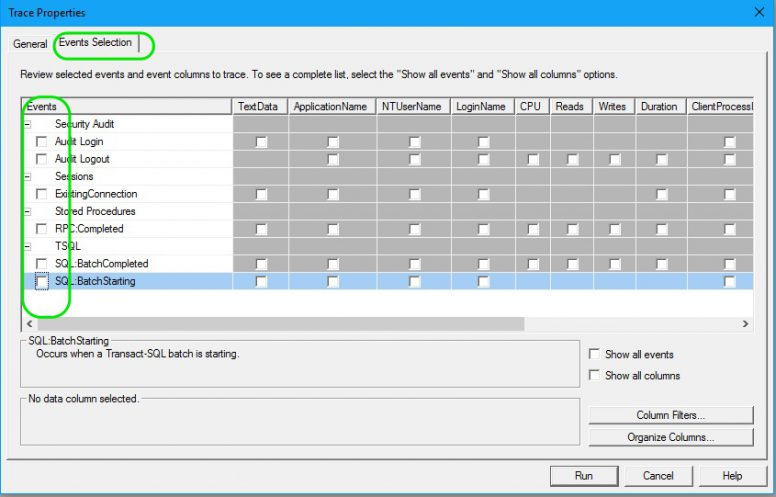
- After entering a name for the trace, go to Events Section and un-select all the pre-selected events.
- Now, select the Show all events and Show all columns check box, so as all the vents are displayed in the grid above.
- In the Events grid, from under TSQL group and select SQL:BatchCompleted.
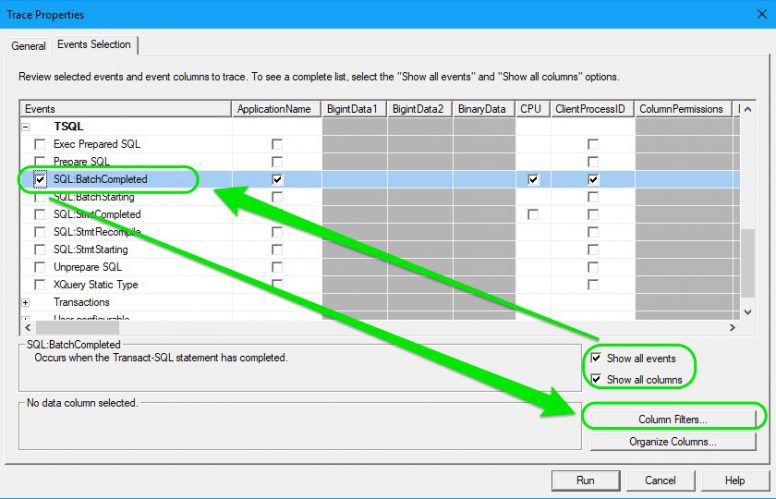
- After selecting the event, you have to add a filter to trace the queries running for more than a second i.e. 1000 milliseconds (NOTE: This time period is up to you. Based on your database performance expectation, specify any time in milliseconds. If you wish to set the poor performance time is more than 2 minutes, then enter 2000). To set the filter, press Column Filters button at the right bottom.
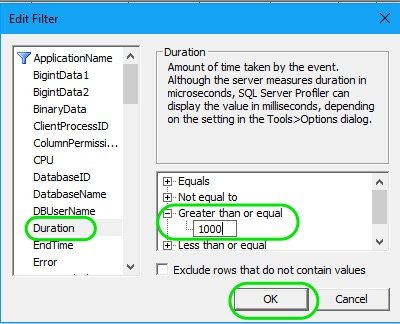
- In the Filter window, select Duration from the left panel. From the right panel, select Greater than or equal and enter 1000 in the box. Then, press OK on the filter window.
- Finally, press the Run button at the bottom.
- The trace will be running and you can watch the live data. For illustration purpose, I’ve created a stored procedure called MyTecBitsToDelay and executed it couple of times. On execution, this stored procedure will wait for 2 seconds and run a select statement.
- If you notice the trace window, You can see the captured stored procedure.
- Continue collecting the poor queries by batch as long as you need and save the collected data for further analysis.
Storing Collected Queries In A Table
Follow the steps in my other article to store the collected queries to a database table.
Caution Note
Using MSSQL Profiler to trace poor performing queries will consume lot of server resources. So, try to run the profiler as short time as possible. If you want to collect poor queries for longer time like several hours or days, then try using the Extended Events.