
In my earlier article I wrote how to filter profiler trace to display events from a specific database. Today I am writing about using SQL Server profiler to debug the queries executed from inside the stored procedures. There are several ways to debug a stored procedures and the queries inside them. Using profiler is one among the easiest way to debug by capturing the queries and statements executed from inside the procedures. You can even use the this technique in the production environment. This profiler debugging method comes handy when the procedure you are debugging has complex logic with hundreds of queries. In profiler trace window, you have to use the event classes SP:StmtCompleted or SP:StmtStarting separately or together to capture the queries executed from inside a stored procedure. Here is the step by step instruction on how to use profiler for debugging queries inside stored procedure.
- Launch profiler and go to menu Files > New Event….
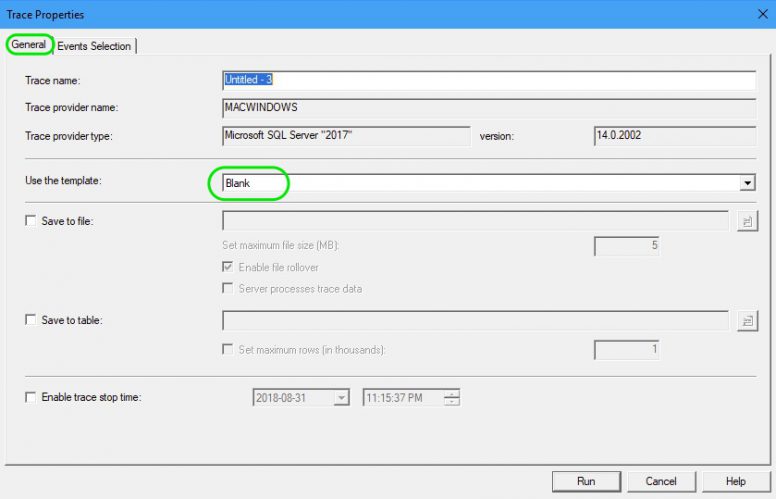
- Connect to the server and in the Trace Properties window, under the General tab, against the Use the template select Blank from the drop down list.
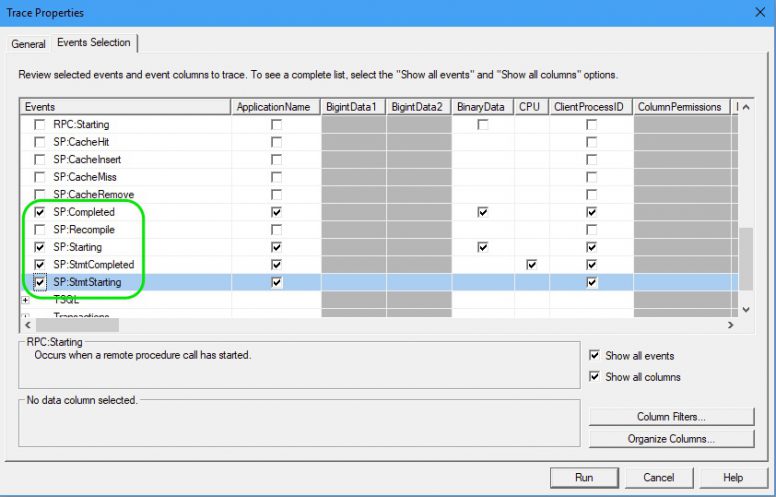
- Now go to the Events Selection tab in the same window.
- From the Events Category list select the node Errors and Warnings right-click and choose Select Event Category to select all the events in the category. (NOTE: This is an optional step. You may need this if you are debugging the stored procedure for any errors.)
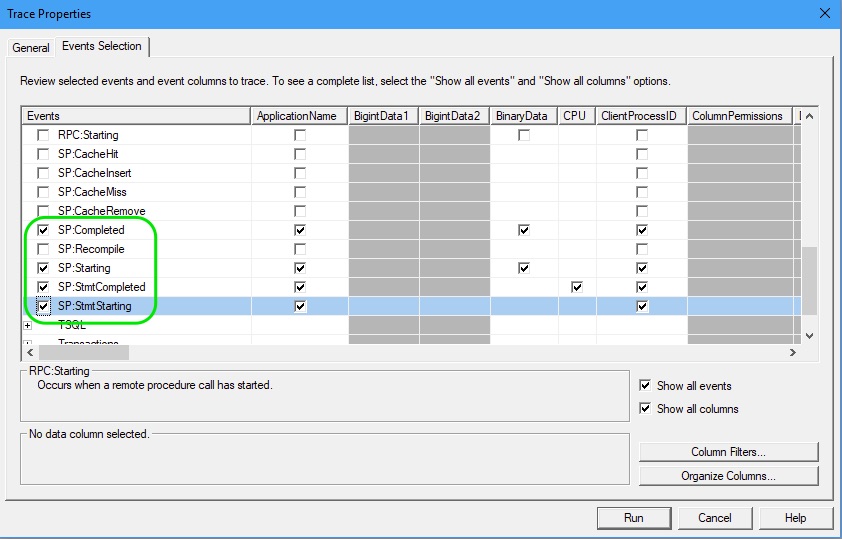
- Then expand the node Stored Procedures and select these events:
- SP:Completed
- SP:Starting
- SP:StmtCompleted
- SP:StmtStarting
- Now you need to add a filter to capture only the events triggered by the stored procedure you wanted to debug.
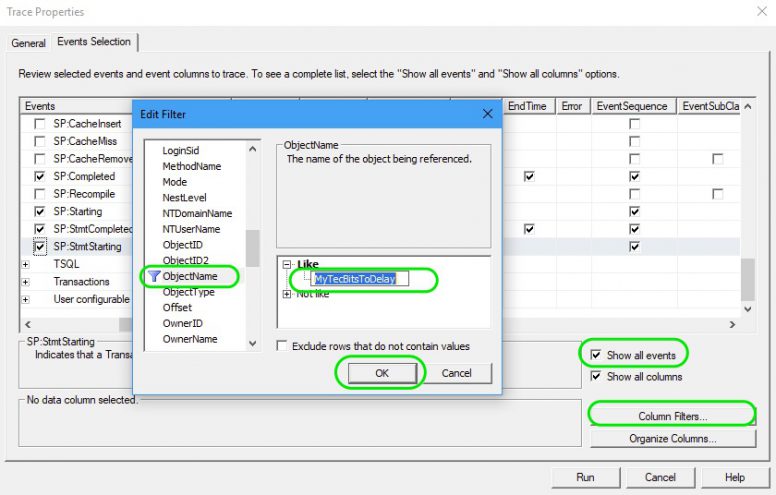
- Make sure the check box Show all columns is selected.
- Press the Columns Filters… button.
- In the Filter pop-up window, from the left panel select Object Name.
- From the right panel, under Like tree node, enter the stored procedure name and press OK.
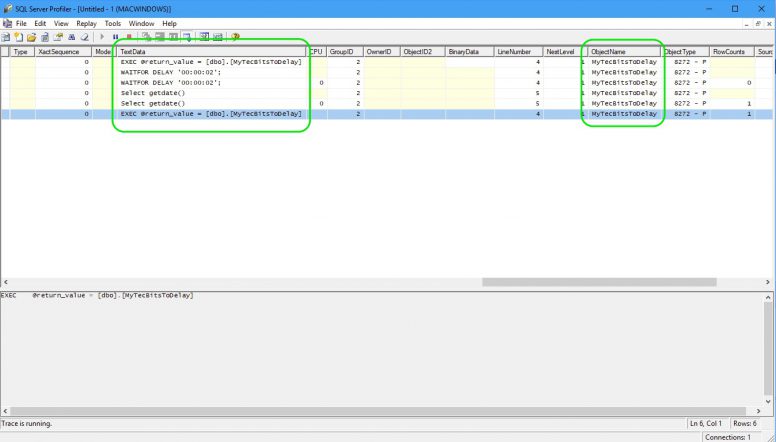
- Then, press Run button to start the trace. The profiler trace will capture the queries and statements only from the stored procedure or the object name you have entered in the filter window. From the profiler trace, you can see all the queries executed from the stored procedure. If any of the query threw error, then you can find the error and it’s details in the next line.
Related Articles
- Ways to find long running stored procedures causing performance issues.
Hi,
Thanks for this tutorial!
What other steps should I do when the SP will stuck at some point? What should I check then? Locks / semaphores/ processes, etc?
PS. Cannot open bigger pictures?
Thanks very much, the only mistake I was doing was not adding ‘ObjectName’ filter. This really helped.
Hi Mohit,
Nice to know that this article is of some help to you.
Thank you.