
As a DBA or a database programmer, you may often need to run the profiler and trap the queries and statements either for error debugging or to find performance issues. Most of the time you may want to limit the tracing to a specific database. Here is the step by step instruction to filter the profiler trace to display events from a specific database.
Steps To Filter Profiler Trace For Events From A Database
- From the profiler trace window, go to menu Files > Properties.
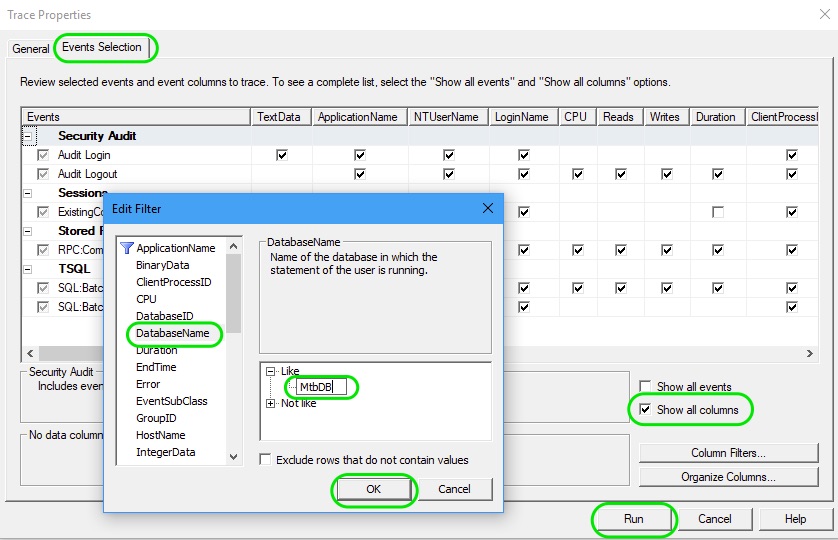
- In the Trace Properties window, go to Events Selections tab.
- Select the check box Show all columns.
- Press the Columns Filters… button below.
- In the Filter pop-up window, from the left panel select DatabaseName.
- From the right panel, under Like tree node, enter the database name and press OK.
- Then, press Run button to start the trace.
Now the profiler trace window will capture only the events from the specified database.
Related Articles
- SQL Server Profiler is still the handy tool for tracing SQL queries and statements. Sometime in future profiler may be replaced with Extended Events.
- Simple trick to debug queries and statements executed from inside a stored procedure.
Great instructions – exactly what I was looking for. We have many database and this helps narrow down the noise.
Hi Michael,
Good to know that this article helped you.